Quick Start Guide
For those of you who are eager to get started, this quick start guide covers the following basic operations on assembly graphs.
- Load an assembly graph
- Get basic graph-based statistics
- Get basic sequence-based statistics
- Get paths
- Query neighbors of a segment
- Get the adjacency matrix
- Query segment sequences
- Plot the graph
We will use the following example assembly graph.
H   VN:Z:1.0
S   1   ACGTACGT
S   2   CGTACGTA
S   3   GTACGTAG
S   4   GTACGTAC
S   5   TACGTACC
L   1   +   2   +   7M
L   2   +   3   +   7M
L   2   +   4   +   7M
L   3   +   5   +   7M
L   4   +   5   +   7M
P   path1   1+,2+,3+,5+ 7M,7M,7M
P   path2   1+,2+,4+,5+ 7M,7M,7M
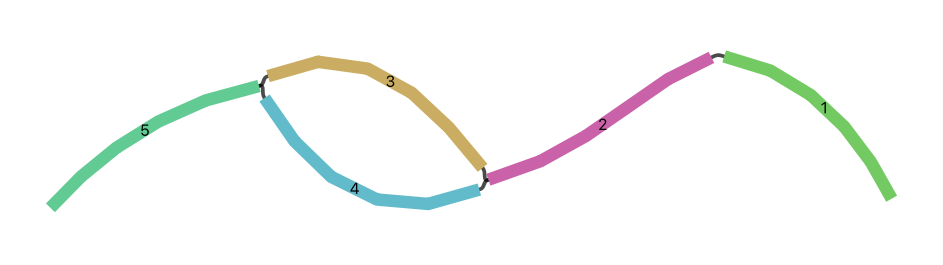
If you visualise this graph using Bandage, it will look as follows.
from agtools.core.unitig_graph import UnitigGraph
import igraph as ig
# Load the unitig-level assembly graph from the GFA file
ug = UnitigGraph.from_gfa("assembly_graph.gfa")
# Print basic graph-based statistics
print(f"Number of vertices (segments): {ug.vcount}")
print(f"Number of edges (links): {ug.ecount}")
print(f"Number of self-loops (repeats): {len(ug.self_loops)}")
print(f"Average node degree: {ug.calculate_average_node_degree()}")
print(f"Number of connected components: {len(ug.get_connected_components())}")
# Print basic sequence-based statistics
print(f"Total length of segments: {ug.calculate_total_length()}")
print(f"Average length of segments: {ug.calculate_average_segment_length()}")
print(f"GC content of segments: {ug.get_gc_content()}")
print(f"N50 and L50: {ug.calculate_n50_l50()}")
# Print oriented links
for from_link in ug.oriented_links:
for to_link in ug.oriented_links[from_link]:
for orient in ug.oriented_links[from_link][to_link]:
print(ug.segment_names[from_link], orient[0], "->", ug.segment_names[to_link], orient[1])
# Print paths
for path in ug.path_index:
# Path name: path string, path overlaps
print(path, ":", ug.get_path(path))
# Get neighbours of a segment
print(f"Neighbours of segment 5: {ug.get_neighbors('5')}")
# Print adjacency matrix
print("Adjacency matrix:")
print(ug.get_adjacency_matrix())
# Print segments
for seg_id in range(len(ug.segment_names)):
# internal segment ID, segment name, segment sequence, segment length
print(seg_id, ug.segment_names[seg_id], ug.get_segment_sequence(ug.segment_names[seg_id]), ug.segment_lengths[ug.segment_names[seg_id]])
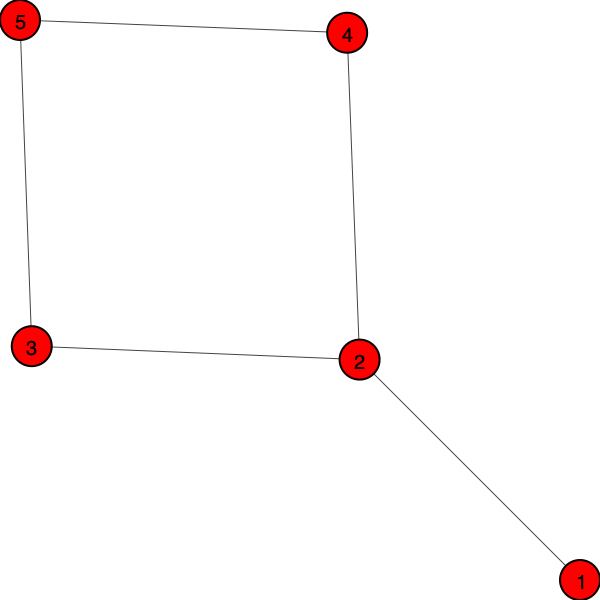
# Plot the graph using igraph
ig.plot(
ug.graph, # graph object
"graph_plot.png", # file name
vertex_label=ug.graph.vs["name"], # label names
vertex_size=40, # vertex size
vertex_frame_width=2.0, #vertex frame width
vertex_label_size=20.0, # vertex label size
)
The plotted graph is shown below.